
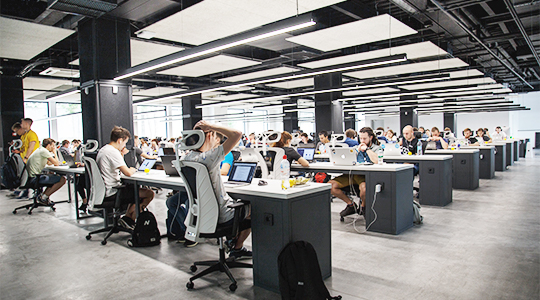
Okay, so I’ve been messing around with this idea of tracking how much space we’re actually using in our office. You know, facilities management stuff. It all started because we’re thinking of moving, and nobody had a clue how much space we really need. “Do we need more desks? Fewer meeting rooms? A bigger kitchen?” All these questions, and no real answers.
So, I started digging.
The Manual Count (It Was Awful)
First, I literally just walked around with a clipboard and a pen. Seriously. I counted desks, chairs, people… everything. I felt like I was back in school counting beans or something. It took forever, and I’m pretty sure my numbers were off. People move around! Some desks were empty because folks were in meetings, others were on vacation. It was a mess.
The Spreadsheet Nightmare
Then, I thought, “Okay, I’ll be smart. I’ll use a spreadsheet!” I dumped all my (probably inaccurate) counts into a giant spreadsheet. I tried to add formulas to account for, like, “average occupancy” and “peak usage.” It quickly became this monster spreadsheet with tabs and colors and… I got lost in it. Updating it was a pain, and it still didn’t give me a live view of what was happening.
The “Smart” Sensor Idea
This is where things got a little more interesting. I started looking into sensors. I mean, there are sensors for everything these days, right? I found a few options:
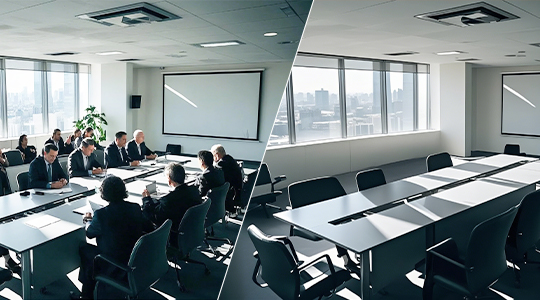
- Occupancy Sensors: These are pretty basic. They detect if someone is in a specific area, like a desk or a meeting room.
- People Counters: These are usually placed at entrances and exits to count how many people are in a room or building.
- Computer Vision: It needs to setup cameras to monitor and track, by calculating the pixels of each area to define the usage.
I started with a few cheap occupancy sensors, the kind you might use for lights. I stuck them under desks and in a couple of meeting rooms. The idea was to get a sense of how often these spaces were actually being used, not just how often they were supposed to be used.
Wiring and Data Wrangling
Getting the data from these sensors was the next hurdle. Some sensors had their own little apps, others needed to be wired up to a… thing. I’m not an electrician, so this involved a lot of Googling and asking for help from the IT guys. Eventually, I managed to get the sensor data flowing into a simple database.
Visualizing the Chaos
Once I had the data, I needed a way to see it. I played around with some dashboarding tools. I wanted something that would show me, in real-time, which areas were busy and which were empty. I ended up using a simple chart that showed occupancy levels over time. It was pretty cool to see the patterns emerge – like, how the meeting rooms were packed on Monday mornings but empty on Friday afternoons.
The “Aha!” Moment
The real “aha!” moment came when I overlaid the sensor data with our floor plan. Suddenly, I could see exactly where the space was being used (or not used). It became obvious that we had way too many desks in one area and not enough collaborative spaces in another. This was gold! This was the kind of information we needed to make smart decisions about our future office space.
What’s Next?
This is still a work in progress. I’m looking at integrating more sensors, maybe even trying out some of those fancy people counters. I also want to refine the dashboard to make it even easier to understand. But even at this early stage, it’s been incredibly useful. It’s moved us from “guessing” about space usage to actually knowing.
It showes the great potential to save the company a lot of money in long run.