
A store can have plenty of visitors and still struggle to sell.
That sounds obvious, but it creates a common problem in retail management: when sales fall, teams often look first at pricing, promotions, product selection, or staff performance.
There is another possibility.
The data used to calculate the store’s conversion rate may be wrong.
The basic formula looks simple:
Retail conversion rate = transactions ÷ store visitors × 100
The transaction number usually comes from the POS system. It is relatively easy to record.
The difficult number is the denominator.
How many real potential customers actually entered the store?
That question is where many retail analytics systems become less reliable.
Why a Simple Conversion Formula Can Hide a Data Problem
Imagine two stores.
Store A receives 1,000 visitors and records 150 transactions.
Store B receives 1,500 visitors and records 165 transactions.
At first glance, Store B looks stronger because it has more transactions.
But the numbers tell a different story when conversion is calculated.
- Store A: 15% conversion
- Store B: 11% conversion
Store B attracted more people but converted fewer of them proportionally.
That distinction matters because traffic and conversion answer different questions.
Foot traffic analytics tells retailers how much opportunity entered the store. Conversion tells them how much of that opportunity became transactions.
Recent retail analytics research makes the same point: a high-traffic day can generate more sales while still producing a weaker conversion rate.
But there is a deeper issue.
What if Store B’s 1,500 visitors were not actually 1,500 potential customers?
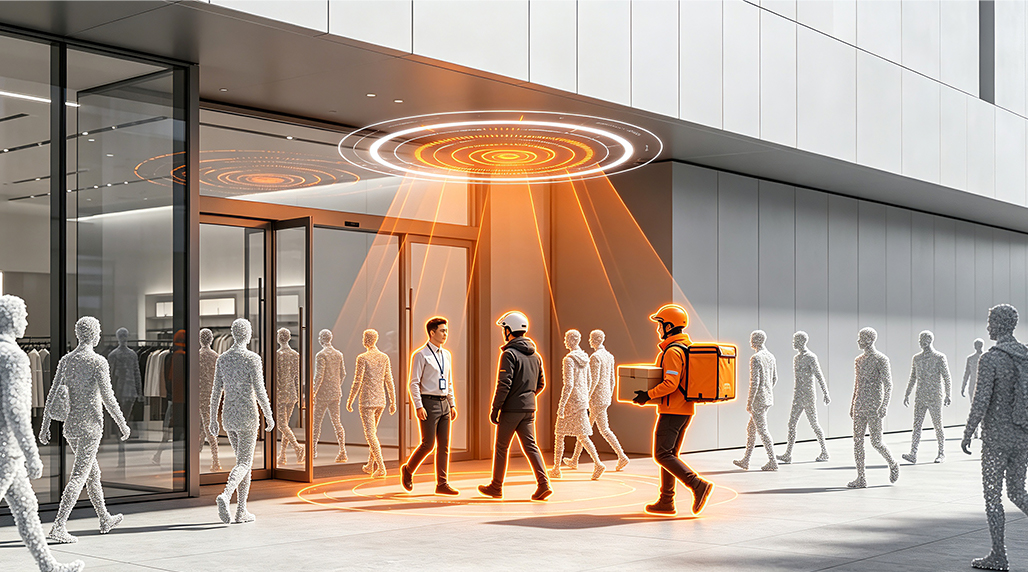
Employees may enter and leave repeatedly. Delivery workers may cross the entrance. Staff may move between different areas. A customer may walk out and return several times.
A basic counter can treat many of these events as customer visits.
The result is a distorted denominator.
And once the denominator is distorted, the retail conversion rate becomes misleading even if the POS data is perfectly accurate.
What Is the Biggest Data Problem Behind Low Retail Conversion?
In many physical stores, the weakest part of the conversion calculation is not sales data. It is visitor data.
A POS system knows when a transaction happens.
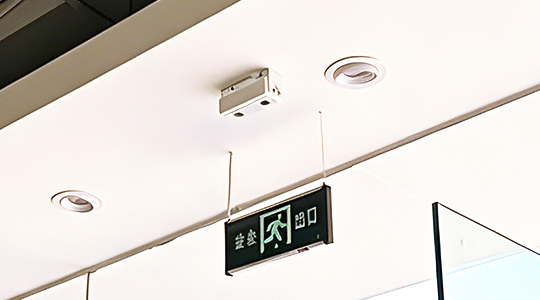
An entrance counter needs to determine who should count as a visitor.
This difference is easy to overlook.
Traditional people counting systems may simply detect movement across a doorway. That can be useful for measuring general traffic, but it does not necessarily identify customer traffic.
Consider a store with:
- 800 detected entries
- 120 employee entries
- 60 delivery or service entries
- 100 repeat entries
- 520 likely customer visits
- 104 transactions
Using all detected entries produces an apparent conversion of 13%.
Using the estimated customer denominator produces 20%.
Neither calculation is automatically correct without a reliable measurement method. But the example shows why retailers should not assume that every detected movement represents a sales opportunity.
This is why store traffic data needs to be treated as a measurement problem, not just a counting problem.
Why Poor Traffic Data Leads to Poor Decisions
A weak denominator can affect almost every downstream retail decision.
Suppose management sees a declining retail conversion rate.
They may conclude that employees are selling poorly.
So they increase sales training.
But perhaps the actual issue is that the store counter is including staff and repeated entries.
Another store may show a strong conversion rate.
Management may assume its sales team is outperforming.
But if that store has cleaner traffic measurement, the comparison may not be fair.
The problem becomes even more serious when retailers compare dozens or hundreds of locations.
If each store measures visitors differently, the resulting performance rankings can look precise while being statistically weak.
This is one reason modern conversion analytics is moving beyond simple visitor totals.
The useful question is no longer:
How many people entered?
It is:
How many relevant customer opportunities entered, and what happened after they entered?
How Should Retailers Improve Conversion Measurement?
The first step is to separate traffic measurement from transaction measurement.
A practical data architecture can contain four layers:
1. Traffic layer
Measure entries and exits at the store entrance.
2. Filtering layer
Identify employees, non-customer traffic, repeated visits, and other non-target events where the technology allows it.
3. Transaction layer
Collect purchase information from the POS system.
4. Analysis layer
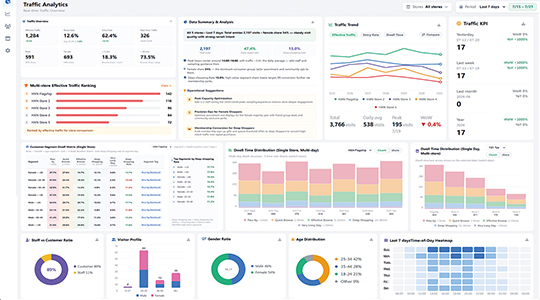
Match traffic and transaction data by store, date, hour, and other useful dimensions.
This creates a much stronger foundation for customer behavior analytics.
It also makes troubleshooting easier.
If traffic falls but conversion remains stable, the issue may be demand generation.
If traffic remains stable but conversion falls, the problem may be merchandising, staffing, pricing, product availability, or customer experience.
If both traffic and conversion suddenly change after a measurement-system update, the data itself should be checked before operational conclusions are made.
That last step is often skipped.
What Should Retailers Look at Besides the Conversion Rate?
A single percentage rarely explains a store.
Retailers should examine several connected indicators:
- Qualified visitor count
- Entry and exit volume
- Repeat-visit patterns
- Employee traffic
- Hourly traffic distribution
- Dwell time
- Zone engagement
- Transactions
- Average transaction value
- Sales per visitor
This creates a more complete retail traffic analysis framework.
For example, two stores may both have a 15% conversion rate.
Store A has 1,000 qualified visitors and 150 transactions.
Store B has 400 qualified visitors and 60 transactions.
Their conversion rates are identical, but their commercial situations are very different.
One may have a traffic-generation problem. The other may have limited store capacity or a different market position.
Conversion should therefore be read together with traffic volume and transaction value.
FAQ: What Is a Good Retail Conversion Rate?
There is no single conversion rate that is universally “good.”
Retail format, product category, location, price point, customer intent, and measurement method all affect the number.
Industry benchmarks can provide context, but retailers should first establish reliable internal baselines and compare stores with similar operating conditions. Even published benchmark ranges vary significantly by retail format.
The more useful question is:
Is this store converting its available customer traffic better or worse than its own historical baseline and comparable stores?
FAQ: Why Can Store Traffic Increase While Sales Conversion Falls?
Because more traffic does not automatically mean more buying intent.
A promotion may attract many browsers. A nearby event may increase casual visits. A location may experience seasonal traffic with lower purchase intent.
There is also a measurement issue: if the traffic counter includes non-customer movement, the denominator can grow without creating additional sales opportunities.
That is why foot traffic analytics should distinguish traffic volume from traffic quality whenever possible.
FAQ: How Can AI Improve Retail Conversion Analysis?
AI can help when it is used to classify and interpret traffic rather than simply generate another visitor number.
Computer vision systems, for example, can identify movement patterns and apply rules for employee exclusion, repeat-visit handling, direction detection, and other traffic classification tasks.
The goal is not to replace the POS system.
It is to make the visitor data feeding the retail conversion rate more representative of actual customer opportunities.
That distinction matters.
Better conversion analysis does not necessarily require more data. Often, it requires better data at the beginning of the calculation.
The Real Retail Conversion Problem Is Often Hidden Upstream
Retailers naturally focus on the final number: sales.
But sales are the end of a chain.
Traffic → qualified visitors → engagement → transaction → revenue
If the first measurement is unreliable, every metric built on top of it becomes harder to trust.
That is why the next generation of retail analytics is moving from basic people counting toward more contextual traffic intelligence.
The objective is not simply to count everyone who crosses a doorway.
It is to understand which traffic represents a genuine commercial opportunity and how effectively the store converts that opportunity.
A better retail conversion rate does not begin with a better sales report.
It begins with a better denominator.
And for retailers trying to understand why performance changes, that may be the most important hidden data problem to solve.